This post is part of a series of "learning everything with R: An R book list". You can clink on this link to see other relevant posts.

Despite R's popularity, it is still very daunting to learn R as R has no click-and-point feature like SPSS and learning R usually takes lots of time. No worries! As self-R learner like us, we constantly receive the requests about how to learn R. Besides hiring someone to teach you or paying tuition fees for online courses, our suggestion is that you can also pick up some books that fit your current R programming level. Therefore, in this post, we would like to share some good books that teach you how to learn programming in R based on three levels: elementary, intermediate, and advanced levels. Each level focuses on one task so you will know whether these books fit your needs. While the following books do not necessarily focus on the task we define, you should focus the task when you reading these books so you are not lost in contexts.

Elementary level: Books introducing R

At this level, I am expecting that you have very limited experience in using R or have forgotten how to use it. You should focus on familiarizing yourself with R instead of learning programming at this stage. From our teaching R experience, a great start is to learn R with something that you are familiar with. If you are not a statistics student or graduate, you probably learn statistics from using software like Excel, SPSS, STATA, SAS, Matlab...etc. The following books will help convert your knowledge to learning R.


R books for other statistical software users
Book Cover Extracted summary
Book Title: R for Excel Users:
An Introduction to R for Excel Analysts

Author: John Taveras
This book is for beginners, and the goal is to get you started.
R is known to have a steep learning curve, but I really think
it has three separate curves: (1) data management, (2)
statistics and (3) visualization.
Book Title: R for Microsoft® Excel Users:
Making the Transition for Statistical Analysis

Author: Conrad Carlberg
This book reviews how to perform key tasks in Excel, and then
guides you through reaching the same outcome in R—including
which packages to install and how to access them.
Book Title: R Through Excel:
A Spreadsheet Interface for Statistics, Data Analysis, and Graphics

Author: Heiberger, Richard M., Neuwirth, Erich
This book builds on RExcel, a free add-in for Excel that can
be downloaded from the R distribution network. RExcel seamlessly
integrates the entire set of R's statistical and graphical methods
into Excel
Book Title: SAS and R:
Data Management, Statistical Analysis, and Graphics

Author: Ken Kleinman and Nicholas J. Horton
This book explains how to easily perform an analytical task in
both SAS and R, without having to navigate through the extensive,
idiosyncratic, and sometimes unwieldy software documentation.
The book also covers many common tasks.
Book Title: R for SAS and SPSS Users
Author: Muenchen, Robert A
This book introduces R using SAS and SPSS terms with which you are
already familiar. It demonstrates which of the add-on packages are
most like SAS and SPSS and compares them to R's built-in functions.
Book Title: R for Stata Users
Author: Muenchen, Robert A., Hilbe, Joseph M.
This book introduces R using Stata terminology with which you are
already familiar. It steps through more than 30 programs written
in both languages, comparing and contrasting the two packages'
different approaches.
Book Title: R and MATLAB
Author: David E. Hiebeler
This book is designed for users who already know R or MATLAB and
now need to learn the other platform. The book makes the transition
from one platform to the other as quick and painless as possible.
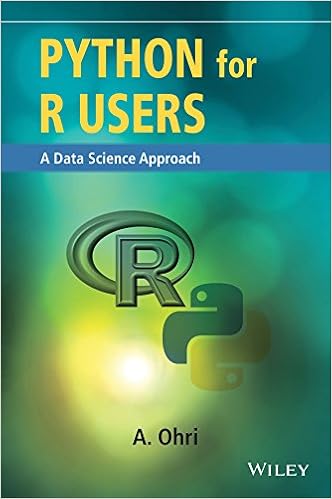
Book Title: Python for R Users
Author: Ajay Ohri
This book is the first of its kind to provide a reference that enables
students and practitioners to easily learn to code in Python if they are
familiar with R and vice versa, even if they are beginners in the second
language. It also provides a detailed introduction and overview of each
language to the reader who might be unfamiliar with the other.


Another way to leverage your knowledge is by using your field knowledge like finance, economics, education...et al. You can find those books in my another post here.

Intermediate level: Books instructing you how to write functions


Books instructing you how to write functions
Book Cover Extracted summary
Book Title: Hands-On Programming with R:
Write Your Own Functions and Simulations

Author: Garrett Grolemund
This book teach you to learn how to load data, assemble
and disassemble data objects, navigate R’s environment
system, write your own functions, and use all of R’s
programming tools.
Book Title: The R Software:
Fundamentals of Programming and Statistical Analysis

Author: Pierre Lafaye de Micheaux, Rémy Drouilhet, Benoit Liquet
This book is presented so as to be both comprehensive
and easy for the reader to use. Besides its application
as a self-learning text, this book can support lectures
on R at any level from beginner to advanced
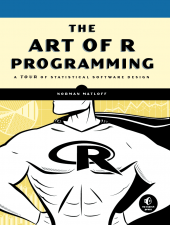
Book Title: Art of R Programming
Author: Norman Matloff
This book takes you on a guided tour of software
development with R, from basic types and data structures to
advanced topics. No statistical knowledge is required,
and your programming skills can range from hobbyist to pro.
Book Title: Software for Data Analysis
Programming with R

Author: Chambers, John
This book guides the reader through programming with R,
beginning with simple interactive use and progressing by
gradual stages, starting with simple functions.
Book Title: Introduction to Scientific Programming and
Simulation Using R

Author: Owen Jones et al.
This book introduces scientific programming and stochastic
modelling in a clear, practical, and thorough way. Readers
learn programming by experimenting with the provided R code
and data.


Advanced level: Books teaching you how to write packages and extend R

If you have read all the books above or written some R functions, why not starting to write your own packages? Making packages is a great way to share your code and most importantly you will learn how to document your code. If you would like to see a quick tutorial post on how to learn writing R packages, we also recommend Karl Broman's R package primer . The following book list starts with Hadley Wickham's R packages which provides detailed step-by-step procedures to build your very first own package. Once you finish reading Hadley's R packages, you can read Hadley's R packages and Richard's Testing R Code to test and improve your package.

If you want to extend R, other two books will equip you with great programmer tools and knowledge. The book,Advanced R Data Programming and the Cloud , will teach you how to connect R to databases such as SQLite, PostgeSQL, and MongoDB. John's Extending R will demonstrate how to incorporate a new structure for interfaces applicable to a variety of languages such as Python, Julia, and C++.


Books teaching you how to write packages
Book Cover Extracted summary
Book Title: R packages
Author: Hadley Wickham
This book shows you how to bundle reusable R functions, sample
data, and documentation together by applying author Hadley
Wickham’s package development philosophy.
Book Title: Advanced R
Author: Hadley Wickham
This book presents useful tools and techniques for attacking many
types of R programming problems, helping you avoid mistakes and
dead ends. With more than ten years of experience programming in R,
the author illustrates the elegance, beauty, and flexibility in R.
Book Title: Testing R Code
Author: Richard Cotton
Run-time testing with assertive
Development-time testing with testthat
Writing easily maintainable and testable code
Integrating testing into your packages
Book Title: Advanced R
Data Programming and the Cloud
Author: Matt Wiley and Joshua F. Wiley
This book will show you how to manipulate data in modern R
structures and includes connecting R to data bases such as
SQLite, PostgeSQL, and MongoDB. The book closes with a
hands-on section to get R running in the cloud.
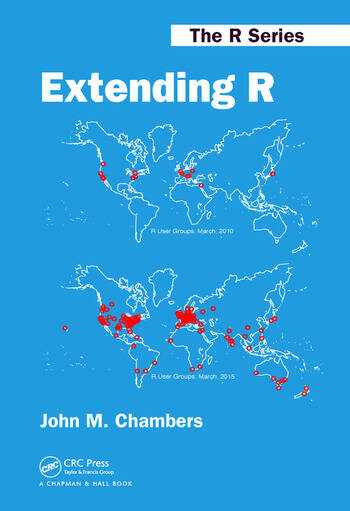
Book Title: Extending R
Author: John M. Chambers
This book covers key concepts and techniques in R to support
analysis and research projects. It presents the core ideas of R,
provides programming guidance for projects of all scales, and
introduces new, valuable techniques that extend R.


Notice that the information above is directly collected from the publisher website and we just summarize it for you. Further details about these books can be assessed by clicking the book title links to the book publisher.

This book list will continuously be updated. If you read this post via R Blogger, remember to go to original post for updates.

Happy learning R and hope you enjoy the book list above!

Page last updated on 18 Dec. 2016.


本文摘述我們與現任國家教育研究院 院長許添明教授、國立東華大學教授吳新傑於台灣一級期刊刊登的結果,主要在討論台灣教育經費適足性的問題,藉由適足性理論去探討是否台灣偏遠地區學校比非偏遠學校需要更多經費。

主要研究發現有以下五點
1. 台灣國際成績表現(PISA)亮眼但城鄉差距拉大:大城市的分數最高且標準差相對較小,而偏遠地方分數較低且標準誤相對較大
2. 平均來說,偏遠地區學生國文、數學基測成績至少低於非偏遠學生10分以上
3. 偏遠地區所需的適足經費,無論是以學生學習成就達基礎級、平均數、精熟級來推估,都一致地高於非偏遠地區所需經費
4. 偏遠地區的教師流動率是非偏遠地區的一倍(6.50% vs. 3.36%)
5. 教師流動率每增加1個百分點,每生支出就會提高0.55%,說明學校因教師流動頻繁將帶來額外支出

研究資料係於 2010 年下半年採用問卷調查取得,針對偏遠與非偏遠國中進行抽測,係採兩階段分層隨機抽樣。依據教育部統計處當時最新的資料,並排除上述四類國中後,公立國中為 706 所,其中偏遠學校扣除掉當時尚未開始招生的南平國中後,總數為 203所,偏遠學校全部施測,非偏遠學校則抽對等數量,即 203 所來施測。

以下專注於用適足性理論去估算偏遠與非偏遠學校適足經費的差異,此乃使用成本函數法估算回歸式,再代入三種適足分數(基礎級、平均數與精熟級),其他變項則帶入各地區之平均值。結果可摘要如下表所示,可知適足經費會隨著適足成績的提升(從基礎級到精熟級)而升高,且不論適足分數是以基礎級、平均數還是以精熟級計算偏遠地區地所需適足經費皆會高於非偏遠地區,也高於臺灣的適足經費,以適足分數等於平均數為例,偏遠地區所需的每生適足經費為 129,687元,不僅高於非偏遠地區( 83,480 元)、也高於臺灣適足經費( 102,784 元),但仍低於偏遠地區的平均值( 134,920 元);且高達 65% 的偏遠學校未達偏遠地區適足經費水準,不僅高於臺灣整體( 60% ),更高於非偏遠地區的( 44% )未達適足經費水準,顯示在現有的經費下,僅有達 35% 的偏遠地區學校可幫助學生達到臺灣的平均基測數學成績。


由結果可知,偏遠地區所需的適足經費,無論是以學生學習成就達基礎級、平均數、精熟級來推估,都一致地高於非偏遠地區所需經費。以平均數作為適足分數為例,偏遠地區所需的每生適足經費高於非偏遠地區約 4.5 萬元( 129,687 元 vs. 83,480 元),且目前偏遠地區達到適足經費的比率又比非偏遠地區低了近兩成( 35% vs. 56% ),即使考慮學校效率,偏遠地區學生為達基測平均數需要更多經費的結果仍未改變,這很可能是導致臺灣 PISA 數學表現城鄉落差的主因。顯示偏遠地區學校亟需政府挹注更多的經費。

全文可於此期刊網站免費下載觀看,該期刊文章引註格式為
張良丞、許添明、吳新傑 (2016)。國民中學適足教育經費:台灣偏遠與非偏遠地區學校的比較。教育科學研究期刊, 61(3), 43-67。 doi: 10.6209/JORIES.2016.61(3).02


This post is part of a series of "learning everything with R: An R book list". You can clink on this link to see other relevant posts.

As R is more and more popular in the industry as well as in the academics for analyzing financial data. For people unfamiliar with R, this post suggests some books for learning financial data analysis using R. From our teaching and learning R experience, the fast way to learn R is to start with the topics you have been familiar with. Thus, the book list below suits people with some background in finance but are not R user. These books below will provide useful guidance for your R learning journey. Try to read and compare these books to find what really fits you.

Fundamental theories: Time series modeling with R


Book Cover Extracted summary
Book Title: Time Series Analysis and Its Applications
With R Examples

Author: Shumway, Robert H., Stoffer, David S.
This book presents a balanced and comprehensive
treatment of both time and frequency domain methods
with accompanying theory. Theory and methodology
are separated to allow presentations on different levels.
Book Title: Applied Time Series Analysis with R
Author: Wayne A. Woodward, Henry L. Gray, Alan C. Elliott
This book includes examples across a variety of fields,
develops theory, and provides an R-based software
package to aid in addressing time series problems
in a broad spectrum of fields.
Book Title: Analyzing Financial Data and
Implementing Financial Models Using R

Author: Clifford Ang
This book teaches students how to use R to analyze
financial data and implement financial models from
start (e.g., obtaining data) to finish (e.g.,
generating output expected for a particular analysis)
using real-world data
Book Title: Practical Time Series Forecasting with R:
A Hands-On Guide

Author: Galit Shmueli and Kenneth C. Lichtendahl
This book providea an applied approach to time-series
forecasting which is an essential component of predictive
analytics. This book also introduces popular forecasting
methods and approaches used in a variety of business applications.
Book Title: Modeling Financial Time Series with S-PLUS®
Author: Eric Zivot and Jiahui Wang
This book represents an integration of theory, methods
, and examples using the S-PLUS statistical modeling
language and the S+FinMetrics module to facilitate the
practice of financial econometrics. This is the first
book to show the power of S-PLUS for the analysis of
time series data.
Book Title: Time Series Analysis With Applications in R
Author: Jonathan D.Cryer and Kung-Sik Chan
This book presents an accessible approach to understanding
time series models and their applications. The new edition
devotes two chapters to the frequency domain
and three to time series regression models, models for
heteroscedasticity, and threshold models.
Book Title: Statistics and Data Analysis for Financial Engineering
Author: David Ruppert and David S. Matteson
This book contains an ideal blend of innovative
research and practical applications, tackles
relevant investor problems, and provides a
multi-disciplined approach, solving problems
from both fundamental and non-traditional methods
Book Title: Financial Analytics with R
Author: David Ruppert and David S. Matteson
This book give examples using financial markets and
economic data to illustrate important concepts.
R Labs with real-data exercises give students practice
in data analysis.
Book Title: R in Finance and Economics
Author: Abhay Kumar Singh and David E Allen
This book provides an introduction to the statistical software
R and its application with an empirical approach in finance
and economics. It is specifically targeted towards undergraduate
and graduate students. It provides beginner-level introduction
to R using RStudio and reproducible research examples.
Book Title: An Introduction to Analysis of Financial Data with R
Author: Ruey S. Tsay
This book explores basic concepts of visualization of financial
data. Through a fundamental balance between theory and
applications, the book supplies readers with an accessible approach
to financial econometric models and their applications to
real-world empirical research.
Book Title: Statistical Analysis of Financial Data in R
Author: René Carmona
Although there are many books on mathematical finance, few deal
with the statistical aspects of modern data analysis as applied
to financial problems. This textbook fills this gap by addressing
some of the most challenging issues facing financial engineers. It
shows how modern statistical techniques can be used in
the solutions of concrete financial problems.
Book Title: Multivariate Time Series Analysis
Author: Ruey S. Tsay
This book is the much anticipated sequel coming from one of
the most influential and prominent experts on the topic of time
series. Through a fundamental balance of theory and methodology,
the book supplies readers with a comprehensible approach to
financial econometric models and their applications to real-world
empirical research.
Book Title: Computational Finance
Author: Argimiro Arratia
This book teaches you how to use the statistical tools
and methods available in the free software R, for
processing and analyzing real financial data
Book Title: Forecasting: principles and practice
Author: Rob J Hyndman and George Athana­sopou­los
This textbook provides a comprehensive introduction to
forecasting methods and presents enough information about
each method for readers to use them sensibly.


Practice: Trading, option pricing, and portforlio optimization with R


Book Cover Extracted summary
Book Title: Automated Trading with R
Quantitative Research and Platform Development

Author: Christopher Conlan
This book has full source code and step-by-step
explanation for plug-and-play trading platform.
Platform can be used in brokerage-level simulation
or production before reading every chapter
Book Title: Option Pricing and Estimation of Financial Models with R
Author: Stefano M. Iacus
This book presents inference and simulation of stochastic process
in the field of model calibration for financial times series
modelled by continuous time processes and numerical option pricing.
It also introduces the bases of probability theory and goes on to
explain how to model financial times series with continuous models.
Book Title: Quantitative Trading with R
Author: Georgakopoulos, H.
This book offers a winning strategy for devising
expertly-crafted and workable trading models using
the R open source programming language, providing
readers with a step-by-step approach to understanding
complex quantitative finance problems and building
functional computer code.
Book Title: Mastering R for Quantitative Finance
Author: Edina Berlinger et al.
This book is organized as a step-by-step practical guide to
using R. Starting with time series analysis, you will also
learn how to forecast the volume for VWAP Trading.
Among other topics, the book covers FX derivatives,
interest rate derivatives, and optimal hedging.
Book Title: Numerical Methods and Optimization in Finance
Author: Manfred Gilli et al.
This book describes computational finance tools.
It covers fundamental numerical analysis and
computational techniques, such as option pricing,
and gives special attention to simulation
and optimization.
Book Title: Tools for Computational Finance
Author: Seydel, Rüdiger
This book covers on an introductory level the very
important issue of computational aspects of
derivative pricing.
Book Title: Financial Risk Forecasting
Author: Jon Danielsson
This book is a complete introduction to practical
quantitative risk management, with a focus on market
risk. It brings together the three key disciplines
of finance, statistics and modeling (programming)
Book Title: Financial Risk Modelling and Portfolio
Optimization with R, 2nd Edition

Author: Bernhard Pfaff
This book is a great collection of many R finance
package introductions. It will be especially useful
for the experienced financial data analysts. It also
provides a plethora of R code examples


Notice that the information above is directly collected from the publisher website and we just summarize it for you. Further details about these books can be assessed by clicking the links to the book publisher. If you would like to get a quick review of financial data analysis using R, see our recent presentation here.

Finally, since more and more books are published these years to address using R in financial data analysis, the book list above might not be comprehensive. You are very welcome to leave the comments below to tell us what we missed. We will try to add them to the list ASAP!

Page last updated on 25 Nov. 2016.


R is a great tool to visualize your data: it is free to use and has lots packages to make beautiful plots. In this post, we gonna teach you how to make time plots to visualize stock returns with data from Yahoo finance. For those not familiar with how to automatically download data from Yahoo Finance with R, we suggest that you take a look at our recent presentation.  Or just follow the steps bellow and copy the code and paste it to R console (RStudio is recommended).

Step 1: Setting the working environment


[code]# Setting the working environment -----------------------------------------
## Install packages for this tutorial
install.packages("quantmod",dependencies = T)
install.packages("PerformanceAnalytics",dependencies = T)
##Make sure R gives English outputs
Sys.setlocale(category = "LC_ALL", locale = "english")
##increase the threshold so R will not convert the ouput into scientific notation
options(scipen = 100)[/code]

Step 2: Loading Data from Yahoo Finance

We gonna extract US stocks prices (SP500) and Australian Stocks prices (ASX200) from Yahoo Finance with quanmod package. Notice that we further convert the daily prices into monthly with the command to.period.

[code]library(quantmod)
SP500 <- getSymbolsundefined"^GSPC",from = "2000-01-01",to = "2016-08-31", auto.assign = FALSE) #Retrieve data for SP500 from yahoo finance
ASX200 <- getSymbolsundefined"^AXJO",from = "2000-01-01",to = "2016-08-31", auto.assign = FALSE)
M.SP500 <- to.periodundefinedSP500,period = "months")
M.ASX200 <- to.periodundefinedASX200,period = "months")[/code]

Step 3: Converting prices into returns

Here, we use adjusted closing prices which include the adjustments for divident payments and stock splits to calculate total returns or holding period returns. If you want to calculate price return or capital gains, you use closing prices

[code]price.M.SP500 <- M.SP500[,6]
Return.M.SP500 <- diff(log(price.M.SP500))[-1] #-1 is used to delete the NA value
price.M.ASX200 <- M.ASX200[,6]
Return.M.ASX200 <- diff(log(price.M.ASX200))[-1] #-1 is used to delete the NA value[/code]

Step 4: Draw the time plot!


[code]library(PerformanceAnalytics)
chart.TimeSeries(cbind(Return.M.SP500,Return.M.ASX200),legend.loc="bottomleft",date.format ="%b-%Y",las = 2, ylab = "Returns",main = "Time Series Plot")[/code]


A little more

We can add grey shaded areas to the plot to mark the important period like the period of global financial crisis(set from 2007-01-31 to 2008-12-31 in this tutorial). This is done by using the arguments, period.areas and period.color.
[code]chart.TimeSeries(cbind(Return.M.SP500,Return.M.ASX200),legend.loc="bottomleft",date.format ="%b-%Y",las = 2, ylab = "Returns",main = "Time Series Plot",period.areas = c("2007-01-31::2008-12-31"),period.color = c("gray"))[/code]


你/妳知道這波退休金制度改革不只影響到軍公教,而是所有台灣人民的退休金嗎? 你/妳知道這波退休金制度改革將會對於世代間所得分配有重要影響嗎? 你/妳知道這波退休金制度改革是審議制,藉由人民參與討論直到2017年才會有正式官方版本嗎? 你/妳知道澳洲也正在進行退休金制度,且跟台灣有著不太相同的改革目標嗎? 退休金制度已經被各國視為能否維持財政永續和人民安定的重要力量,或許多看看他人的做法能帶給台灣一些新的想法。
退休金制度牽繫著每位勞動者的退休生活品質,最早退休金制度可追溯到1889年德國建立起年金保險體系,再到後來隨收隨付制(Pay as you go),此皆由政府負擔,視為國家福利的一部分,此時退休基金是完全的公有化。這種由國家稅收來照顧年長國民的制度,係以世代間所得分配的觀點來進行,年輕世代將部分所得經由政府轉給退休者,等到年輕一代退休再由下一代接棒投入工作所得。這樣的制度要能夠永續進行必須至少要幾個前提,第一個是勞動者平均薪資須大於或等於通貨膨脹,再者勞動人口要能維持或持續增長讓扶養比維持在適當比率,政府對於退休基金的提撥比率要足夠。但自1981年以來,由於人口老化和政府的稅收不足以支撐這個體系,很多國家已逐漸轉向退休金私有化(Pension privatization)制度,也就是由勞動者和雇者主要負擔未來退休生活,政府則轉為輔助者的角色。

台灣過去退休金或年金改革比較針對勞工退休制度進行檢討。最大規模的改革則始於2016蔡英文政府上台以後,特別是面臨各退休基金未來破產的困境,成立總統府國家年金改革委員會,納入其他工作族群(軍公教警消等)一起改革,改革的特色在於是擴大對象,即針對全體人民(不僅限於勞工),改革並採審議制,而非侷限於立法院討論,所有討論相關資料皆可在以上官方網頁獲取資訊。

在正式版本未出爐前,台灣或可參考鄰近先進國家的作法,特別是相似人口數的地區如澳洲,澳洲目前也在進行退休金改革,並已出現可供討論的版本。澳洲向來以福利國家著稱,但另一特色是澳洲更融合了開放市場,其退休金制度特色在於不分工作性質,雇主和員工定期提撥一定比例(目前為9%)的員工薪水至員工退休金帳戶,此退休金帳戶係由不同財務公司營運(據學者2012年統計,目前有200多家),員工可自行決定由哪家公司或自己營運退休金管理。這些定期投入的錢,等到員工退休後即可提領使用,跟台灣勞工或政府雇員目前可終身領取(勞工僅限於是勞保年金可終身領取,勞工退休金則是領完為止)不同的是,澳洲員工退休後僅能領取先前提撥的錢連同投資獲益的錢,這樣的制度學理上又稱Defined Contribution (DC),與美國401(k)類似。

不過,當員工或是無工作的國民的退休金不足以支付其退休生活時,澳洲國民可以向政府centrelink 請領老人年金(age pension);此外,針對收入較低且有退休金帳戶的國民(年收入37000以下),政府每年目前最高補助500澳幣到其退休金帳戶。因此我們可以看到澳洲退休制度並非完全仰賴員工本身的提撥,相當於與政府共同承擔國民老年後的退休生活支出。這概念相當於台灣2008年開辦的國民年金,但國民年金侷限於無工作者,且每月必須繳納保費。要注意的是澳洲老人年金並不需要繳交任何費用。我們整理一個表格如下以比較兩地之退休金制度差異


台灣與澳洲退休金制度比較表

比較點 台灣 澳洲
對象 依不同工作性質有不同退休制度 不分工作性質
年金領取終止 無,終身領取 (但對勞工而言僅限於勞保年金) 直到退休金帳戶歸0
其他退休保障 未參與任何工作保險者可領取國民年金 退休金不足額者可向政府請領老人年金
薪資提撥率 依工作性質而有不同:
  • 勞工是6~12% (雇主強制6%,剩下6%依員工意願)
  • 軍公教12%(政府負擔提撥費用的65%)
  • 9%,預計2022年提高到12%
    退休基金管理 由政府組成委員會管理 由民間公司或自己管理收益
    改革重點 退休基金永續經營 檢視現行退休金制度是否能有效率地帶給成員最佳的結果
    改革進程 預計2017年3~5月完成報告送交政府 預計2020年完成報告送交政府,詳見此份報告第3頁


    從上表比較看來,對於個人退休金而言,澳洲傾向於讓國民承擔更多退休責任和風險(自選退休金營運方式),充分將退休基金私有化或個人化,人民有完全的退休金自主權,這種制度學理上稱確定提撥制(Defined contribution plan;DC),澳洲政府的角色相對退位很多,僅在當國民退休金不足時以老人年金補足。雖然台灣人民不論工作性質皆須提撥固定比率薪水至退休帳戶,但台灣則還是比較偏向由政府掌握人民退休金,不僅管理也負責退休金之營運,但人民最終拿到多少退休金取決於所約定退休辦法,這種制度又稱確定給付制(Defined benefit plan;DB)

    我們要記住的是完全的DC或是DB對人民都沒有好處,因為前者人民要自負退休金風險,後者則由風險則由政府概括承受,可是若國家財政不足,約定的退休金就會面臨縮減危機,因此澳洲政府還會設立養老金制度以幫助退休金不足的人民,這有DB的影子,而台灣勞工的勞工退休金則是取自DC的精神,由此可知如何混合兩種制度以使退休金充足才是重點。當然DC或是DB制哪一種方式比較好尚待研究佐證,比較優劣也非本文重點,而是期望藉由他山之石,可以幫助台灣退休金制度走向更為永續。

    結語: 邁向適足退休金制度

    過去退休金制度著重於提撥率即退休金基金的投入,已有學者呼籲,應從退休金的適足與否來思考,即金額是否足以過有品質的退休金生活。從澳洲最近的改革來看,似乎也是朝向此方向發展,澳洲年金協會(The Association of Superannuation Funds of Australia, ASFA),已經研擬出幾個退休生活的標準,這樣的適足觀點正巧與過去筆者研究的教育財政適足不謀而合,畢竟人民真正關心的是最終的結果是否足夠支付退休生活。事實上,已經有相當的文獻進行個人退休金模擬試算,藉由統計模擬方法如Bootstrapping, Monte Carlo等,用各種投資組合,結合個人相關資訊如收入、提撥率等算出最終可能的退休金金額,從而評估是否適足。

    不過以上這些模擬試算研究比較針對個人,對於台灣財政永續而言,除了考量退休金,政府的其他福利制度(例如其他社會保險、全民健康保險等)也應該一併納入通盤考量,身為一分子的您,也應該共同關心這影響國家財政永續的制度。

    註:
    1. 本文更新於 2017.05.07
    2. 本文部分文字刊登於The Epic Times
    Zhang, L. -C. (2016, November 28). Comparing pension systems in Australia and Taiwan (Part 2), The Epic Times, p. B4. [In Chinese: 張良丞 (2016)。台灣與澳洲退休金制度之比較(下)] [Web version] [News paper version]
    Zhang, L. -C. (2016, October 28). Comparing pension systems in Australia and Taiwan (Part 1), The Epic Times, p. B4. [In Chinese: 張良丞 (2016)。台灣與澳洲退休金制度之比較(上)] [Web version] [News paper version]


    R is an open-source software package and rapidly increases its popularity in both industry and academics. Google trend is probably the best tool to show you how popular R is since it allows us to rank the search interest among five major statistical software packages. You can clearly observe that R has been the top search interest since 2011 and continues to maintain its top place.
    Many authors of the following resources inherit this open-source spirit: they are willing to put their contents online and let everyone can learn R for free. In this post, we collect many free online resources to help you learn R for FREE. Notice that these resources are offered in a different form of format such as videos, books, podcasts, or purely just texts.  We classify these resources based on their formats for fitting your learning styles.

    1. R Courses (with videos)

    2. R Books

    3.R Journals

    4. R Q and A

    5. R Podcasts

    The following first three podcasts are talking about the news about R while the others mainly involve the applications (data science, finance, ... ) in R.


    6. R tutorials 
    This type of learning resources provides some step-by-step procedures to learn R. One trait about them is that these resources are usually offered in the form of texts instead of videos like R courses above. These resources are mainly written by many bloggers. 
    7. R news
    Page last updated on 14 Dec. 2016.