You may consider R as a big calculator running on different operating systems (Windows, Apple, Unix...). The original interface for R is too simple, so many interfaces are developed for different needs. I will introduce three interfaces of R for people from beginners to professionals.

R commander- Running R like SPSS 

SPSS is probably the most popular point-and-click statistical software.  R commander has similar function like SPSS and is very suitable for SPSS users or R beginners. Some examples could be found in the book, Discovering Statistics Using R and the book,  Using the R Commander: A Point-and-Click Interface for R.


RExcel- Running R within Excel

If you still feel uncomfortable about using the unfamiliar interface, why not trying using R within Excel?   RExcel is just the add-in of Excel and you can use R to run more complex models just using Rexcel without seeing R. It also works seamlessly with R commander. Check the book, R through Excel , for more details.


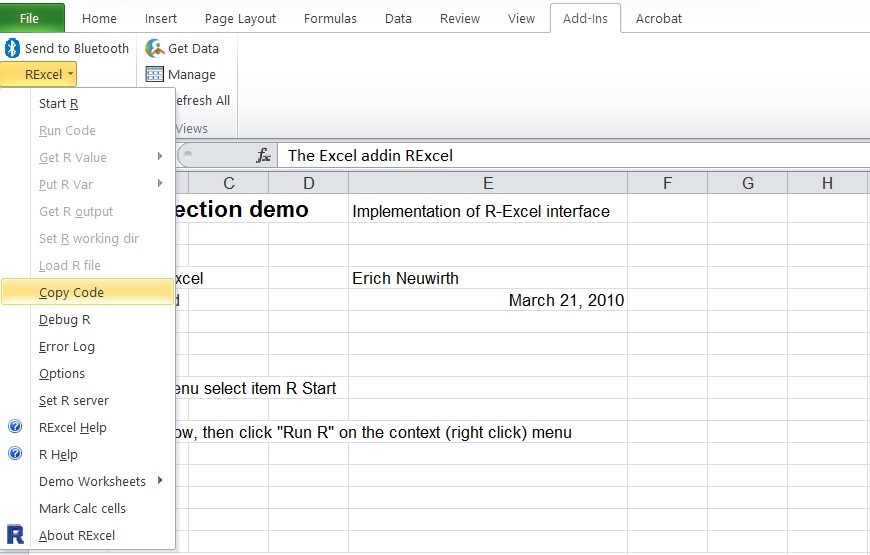
RStudio- Running R like a pro

Once you are more familiar with R codes, Rstudio is a great interface for debugging and integrating all the materials together.


Tinn-R

Of course, some professionals prefer more functions like using colors to discriminate different codes. Another interesting function of Tinn-R is that it provides the function that let you copy the format of the code (including the color) for MS-Word like the following figure.


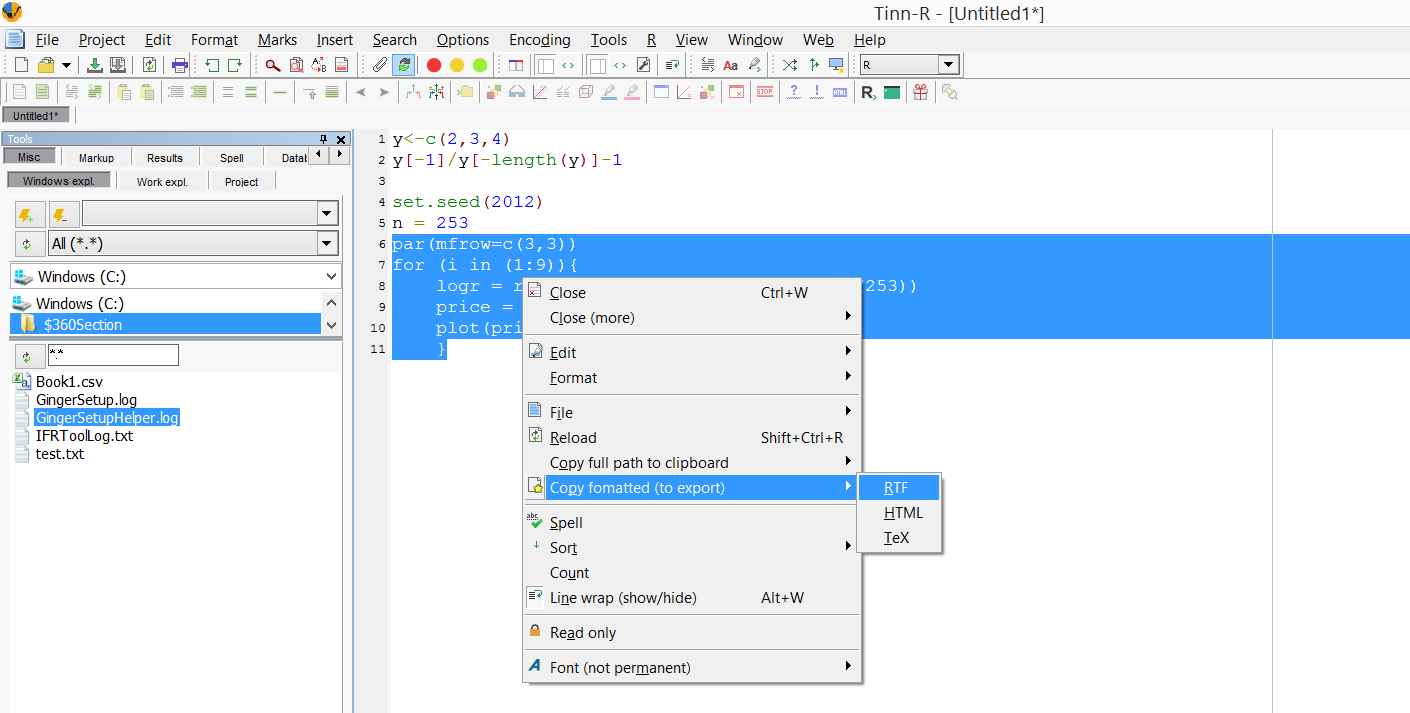
Recently, BlueSky Statistics offers an open source version of GUI for R. Might worth trying as well. http://www.blueskystatistics.com/category-s/118.htm

You can also try to use Sublime text.


Page last updated on 22 June. 2018.


R is an open-source software package and rapidly increases its popularity in both industry and academics. Google trend is probably the best tool to show you how popular R is since it allows us to rank the search interest among five major statistical software packages. You can clearly observe that R has been the top search interest since 2011 and continues to maintain its top place.

R is not easy to learn in the beginning, especially for people getting used to some click-and-point commercial software.  However, as an economist (also see this post) points out the serious question about the computing with some commercial software, we need to give some thoughts about it and try to use other software to confirm the estimation results. One advantage of learning statistics through R is that you get more vivid images about how to really perform your model with your codes.

A good and cheap way is to use R. So, save you money on software but buy the following book instead.  The following books provide readers with their R codes describing how to conduct statistical models with R. These books are displayed in the different sections ordered from easiest to hardest to learn (this order is also applied to book list within the section). Notice that some following books (especially for book title without R) do not teach you how to use R but they provide the codes in the books or their website for you to learn the models. For a more comprehensive R book list, you should take a look at this R website.

R for beginners
R for everyone

Extending RStudio
I have another post to contain the book list for this topic. Please see it here.

Creating applications or software
Programming Graphical User Interfaces in R
Web Application Development with R using Shiny

Probability and Statistics
Discovering Statistics Using R
SPSS could still be the main software in this field and then you must know Prof. Field's book (Discovering Statistics using SPSS). But you want to learn R and you can try his R book as well (Discovering Statistics Using R). The model in these two books are similar but the latter book uses R instead.
Probability and Statistics with R for Engineers and Scientists

Data Visualization
R Graphics
ggplot2: Elegant Graphics for Data Analysis


Business Analytics
Data mining and business analytics with R
Business Analytics for Managers (Use R!)

Regression Model 
A Modern Approach to Regression with R
  • Nonlinear Model
Nonlinear Regression with R
Applied Nonparametric Econometrics
Comparing Groups: Randomization and Bootstrap Methods Using R
Bootstrap methods and their application
An Introduction to Bootstrap Methods with Applications to R

Finance
I have another post to contain the book list for R in Finance. Please see it here.

Actuarial Science
Computational Actuarial Science with R

Econometrics
Data Manipulation with R (Use R!)

Math
Hands-On Matrix Algebra Using R


This article will continuously be updated and I welcome anyone of you to post your experience here.


Page last updated on 18 Dec. 2016.