You may consider R as a big calculator running on different operating systems (Windows, Apple, Unix...). The original interface for R is too simple, so many interfaces are developed for different needs. I will introduce three interfaces of R for people from beginners to professionals.

R commander- Running R like SPSS 

SPSS is probably the most popular point-and-click statistical software.  R commander has similar function like SPSS and is very suitable for SPSS users or R beginners. Some examples could be found in the book, Discovering Statistics Using R and the book,  Using the R Commander: A Point-and-Click Interface for R.


RExcel- Running R within Excel

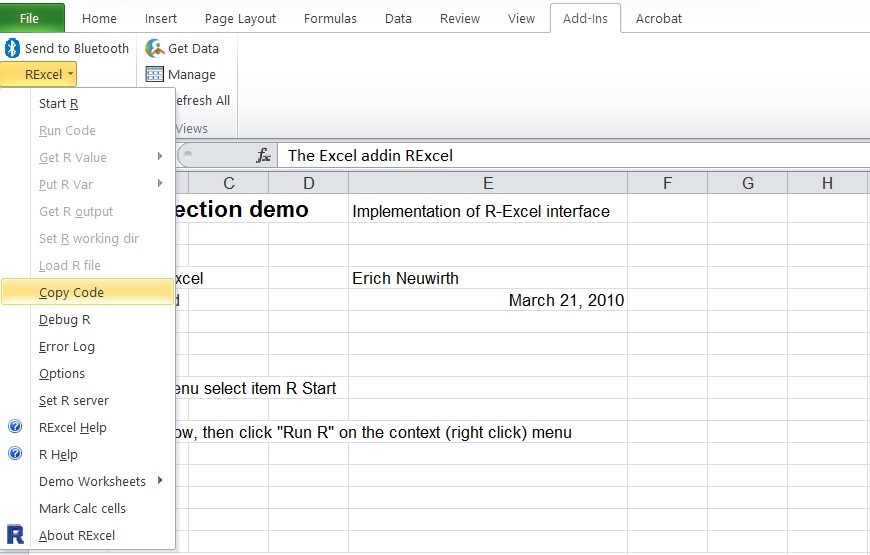
If you still feel uncomfortable about using the unfamiliar interface, why not trying using R within Excel?   RExcel is just the add-in of Excel and you can use R to run more complex models just using Rexcel without seeing R. It also works seamlessly with R commander. Check the book, R through Excel , for more details.


RStudio- Running R like a pro

Once you are more familiar with R codes, Rstudio is a great interface for debugging and integrating all the materials together.


Tinn-R

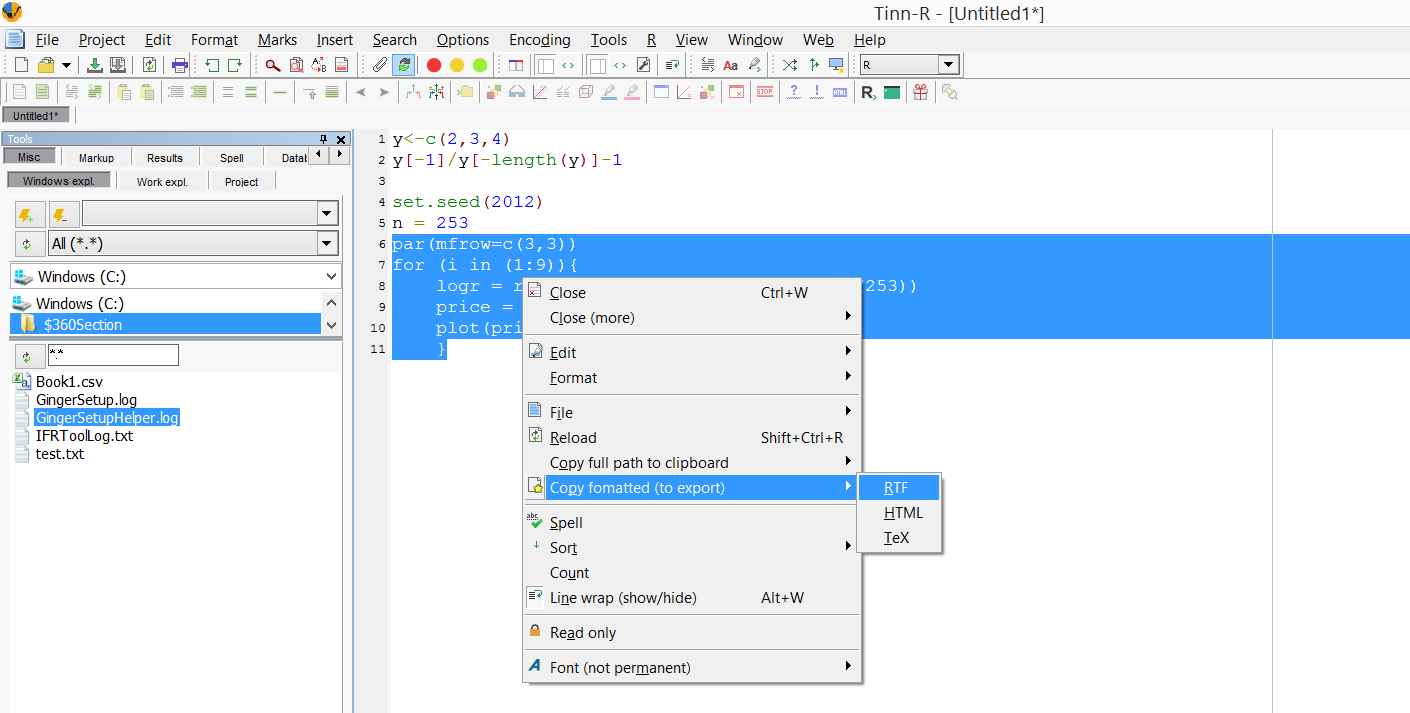
Of course, some professionals prefer more functions like using colors to discriminate different codes. Another interesting function of Tinn-R is that it provides the function that let you copy the format of the code (including the color) for MS-Word like the following figure.


Recently, BlueSky Statistics offers an open source version of GUI for R. Might worth trying as well. http://www.blueskystatistics.com/category-s/118.htm

You can also try to use Sublime text.


Page last updated on 22 June. 2018.


R is an open-source software package and rapidly increases its popularity in both industry and academics. Google trend is probably the best tool to show you how popular R is since it allows us to rank the search interest among five major statistical software packages. You can clearly observe that R has been the top search interest since 2011 and continues to maintain its top place.

R is not easy to learn in the beginning, especially for people getting used to some click-and-point commercial software.  However, as an economist (also see this post) points out the serious question about the computing with some commercial software, we need to give some thoughts about it and try to use other software to confirm the estimation results. One advantage of learning statistics through R is that you get more vivid images about how to really perform your model with your codes.

A good and cheap way is to use R. So, save you money on software but buy the following book instead.  The following books provide readers with their R codes describing how to conduct statistical models with R. These books are displayed in the different sections ordered from easiest to hardest to learn (this order is also applied to book list within the section). Notice that some following books (especially for book title without R) do not teach you how to use R but they provide the codes in the books or their website for you to learn the models. For a more comprehensive R book list, you should take a look at this R website.

R for beginners
R for everyone

Extending RStudio
I have another post to contain the book list for this topic. Please see it here.

Creating applications or software
Programming Graphical User Interfaces in R
Web Application Development with R using Shiny

Probability and Statistics
Discovering Statistics Using R
SPSS could still be the main software in this field and then you must know Prof. Field's book (Discovering Statistics using SPSS). But you want to learn R and you can try his R book as well (Discovering Statistics Using R). The model in these two books are similar but the latter book uses R instead.
Probability and Statistics with R for Engineers and Scientists

Data Visualization
R Graphics
ggplot2: Elegant Graphics for Data Analysis


Business Analytics
Data mining and business analytics with R
Business Analytics for Managers (Use R!)

Regression Model 
A Modern Approach to Regression with R
  • Nonlinear Model
Nonlinear Regression with R
Applied Nonparametric Econometrics
Comparing Groups: Randomization and Bootstrap Methods Using R
Bootstrap methods and their application
An Introduction to Bootstrap Methods with Applications to R

Finance
I have another post to contain the book list for R in Finance. Please see it here.

Actuarial Science
Computational Actuarial Science with R

Econometrics
Data Manipulation with R (Use R!)

Math
Hands-On Matrix Algebra Using R


This article will continuously be updated and I welcome anyone of you to post your experience here.


Page last updated on 18 Dec. 2016.

Writing a journal paper is not easy and too many problems you will encounter such as selecting a proper research methodology and even a topic to start with. In the following list, the references will be shown based on the process of writing a paper.

Before
In this stage, you probably are thinking which topic to start with.

  • Choose a topic 

Choose a topic you are interested in and try to Google it in the Google scholar. You will find previous studies.


  • Have a ResearchGate account

I will recommend you have a account of ResearchGate and then you will have free access to many referred journal articles (some following reference links will lead you to them).


  • Know how to use reference software
I am a user of Endnote and you could find some tips in my another post

  • Learn how to process your data

For a quantitative research, you could see my another post


Writing 


  • How to present your results
For descriptive method, you can see this article for cross-sectional data.


After 


  • Submit your work to a journal
Using a checklist to help you: Checklist for Manuscripts to be Submitted to Scientific Journals.


  • Respond the reviews

A Scientific Approach to Scientific Writing

This article will continuously be updated and I welcome anyone of you to post your experience here.
We always encounter questions and this usually indicates you are doing something new! However, how do we solve the questions we have? Asking someone is usually the best solution, but the question is where to ask? This depends on whom you wish to answer your question and what type of question is. So the following suggestions will depend on whom to answer your question.


  • Questions writing papers

Research Gate: This is probably the Facebook version for Academics. So post some questions about papers or some issues when you writing a paper. Example could be found here.


  • Questions about the R codes

Stack Overflow

This article will continuously be updated and I welcome anyone of you to post your experience here.
Read another article to know how to run BUGS with R. This article focus on the Common difficulties when running BUGS with R and their possible solutions.

Importing Data 
1. not meaningful for factors
This is old problem that not just happens when running BUGS. It sometimes happens because you copy your data from a large data set (in EXCEL) and paste it to a small one. Just change the format cell to "Number"and everything will be fine. 

Change the format cell in EXCEL

This article will continuously be updated and I welcome anyone of you to post your experience here.


小樣本就用質性方法,大樣本就用量化方法?如果選擇研究方法是這麼粗糙,那可能只是沒有選對研究模式而已,貝氏估計(Bayesian estimation),是一個強大且彈性的估計模式,但直到科技、演算法的進步到最近才在運用在各領域。這篇文章提供一些運用貝氏估計在質性方法的建言,可以反思量化與質性方法的區別到底有無必要性
做研究做久了,有些陳述似乎變成就是習慣一定要這樣做,裡如抽樣要來做分層抽樣,然後分層的依據都是根據學校規模。這樣的抽法上到台灣最大的大型教育資料庫(TASA),到最小的碩士論文,都是根據學校規模分層,但我沒看過有人進一步陳述說為什麼。我也是如此,但直到被Reviewer一問,我得自己去找答案,我從自己的專業出發,可能的解釋是我國資源分配受到學校規模影響很深(張良丞、王保進、許添明, 2010; Zhang & Sheu, 2013; 也請看教學實務現場的分享文),大校擁有的資源不論是老師數還是分配到的款項遠多於小校,而這些資源非常有可能去影響研究者正在調查的某項專案成效(例如考試成績、教師教學效果等),Smith and Humlum (2015) 甚至發現學校規模對於學生未來的長期產出(如高中畢業率、薪資等)都有顯著影響。如所以分層以學校規模是有道理的(淡化了資源影響),因為這使得大中小型學校都有被抽到的機會,換句話說,這使得樣本具有代表性來解答研究問題。

當然,我知道應該有比這個更好的說法~有興趣可以一起在這討論
或是我Facebook

文獻

  • 張良丞、王保進、許添明(2010)。以學生學業成就評估國民小學教育經費適足性—以台北市為例。教育與心理研究。33(4),109-136
  • Humlum, M. K., & Smith, N. (2015). Long-term effects of school size on students’ outcomes. Economics of Education Review, 45(0), 28-43. doi: http://dx.doi.org/10.1016/j.econedurev.2015.01.003
  • Zhang, L. -C., & Sheu, T. -M. (2013). Effective investment strategies on mathematics performance in rural areas. Quality & Quantity, 47(5), 2999-3017.
Endnote is probably the most popular reference management software. Its drag and drop function allow you to directly put the reference into your word file by using your mouse alone. In this article, I would like to provides some tips to save you more time.


  • Add a reference without a first name

This usually happens when you want to add a reference with its author having no first name. For example, a report is published by a government or a university, so you can not copy their name and paste it on your endnote. You should use the format:

Last name, first name

and leave the first name blank (since it does not have one) like the following picture (using Harvard University as an example):


Most publishers allow you to export the citation from their website:


However, sometimes, especially for old books, it is hard to find the citation. You can try Google Scholar, and type in the reference title and click the button ,import into Endnote:


Sometimes what we have is the old reference but we some new references to back-up our topic. A follow-up trick of using Google Scholar is to use it to update your references. 
  • Overcome software crash
This happens especially when you update your endnote files from different devices. I found it is solved by upgrade to version 7 (Endnote X7). 


  • Stop endnote from auto updating the bibliography in word
After updating the bibliography, you might do some minor corrections without the intervention of Endnote. You can stop the instant formatting like the following figure. 


This article will continuously be updated and I welcome anyone of you to post your experience here.
Without no doubts, a researcher should several nice tools to handle their data, and testify their results. EXCEL, SPSS, and R represent different stages for doing a research.

1. EXCEL
Most data retrieved from a database has a excel format like xls or xlsx. We probably spend lots time on cleaning missing values and doing some simple valuable transformations with EXCEL.

2. SPSS
What is great about SPSS is that it provides the most direct interface for storing your raw data. Consider SPSS as a extension of EXCEL. It allows the definition of a variable could be stored directly in SPSS format dataset. This will be extremely useful if you are collecting data from surveys.

3. R
The preceding tools provide you with the basic method for analysing your data. On the other hand, R is a powerful statistical language,also suggested by an article from Nature, for analysing more difficult problems. Once you know how to write a function in R, it will save lots of time through avoiding clicking the buttons in the above tools. Data visualization for your data is also a great advantage of R especially using its package, ggplot2. See the examples from Rstudio.


This article will continuously be updated and I welcome anyone of you to post your experience here.
These concepts will involve the definition of technology, functional form, and other matters especially some important theories in micro-economics. These are the fundamental assumptions when developing the methodology of efficiency measurement. My advice is that read Intermediate Microeconomics_A Modern Approach (8th ed), (Ch. 18, 19, 20, 21) or Microeconomic Analysis (3rd) (Ch. 1~6, 12, 26, 27) and then study very carefully about how to estimate these functional forms especially considering their error sources (these are detailed in the book chapter, A Survey of Functional Forms in the Economic Analysis of Production.) If you want to know how to estimate these in practice, the lecture note, Introduction to Econometric Production Analysis with R, is really worth reading since it combines all R codes and data.

Other suggestions are also listed as follows. Carefully read these references in the following order (words in the parentheses indicate the suggested sections).

Production, cost, profit function
Intermediate Microeconomics_A Modern Approach (8th ed), (Ch. 18, 19, 20, 21)
Microeconomic Analysis (3rd) (Ch. 1~6, 12, 26, 27)
Microeconomic Theory (Ch. 5)
Applied production analysis: a dual approach (All)

Distance function
Multi-Output Production and Duality: Theory and Applications

This article will continuously be updated and I welcome anyone of you to post your experience here.